Features · Org reports
One report.
Whoever’s asking.
Every agent session across your teams, rolled into one report — read as risk by the CISO, as engineering by your leads, and as spend by finance. Same telemetry, three ways to read it. No new instrumentation.
What it is
An org report rolls up every agent session across your teams into one weekly read — the risks worth a decision, the engineering patterns worth scaling, and where the spend is going. One source of truth, whether you sign off on risk, ship the roadmap, or own the budget.
Three views
The same run, read three ways.
One report carries every lens. Each role opens the view built for the questions they actually ask — backed by the exact same telemetry.

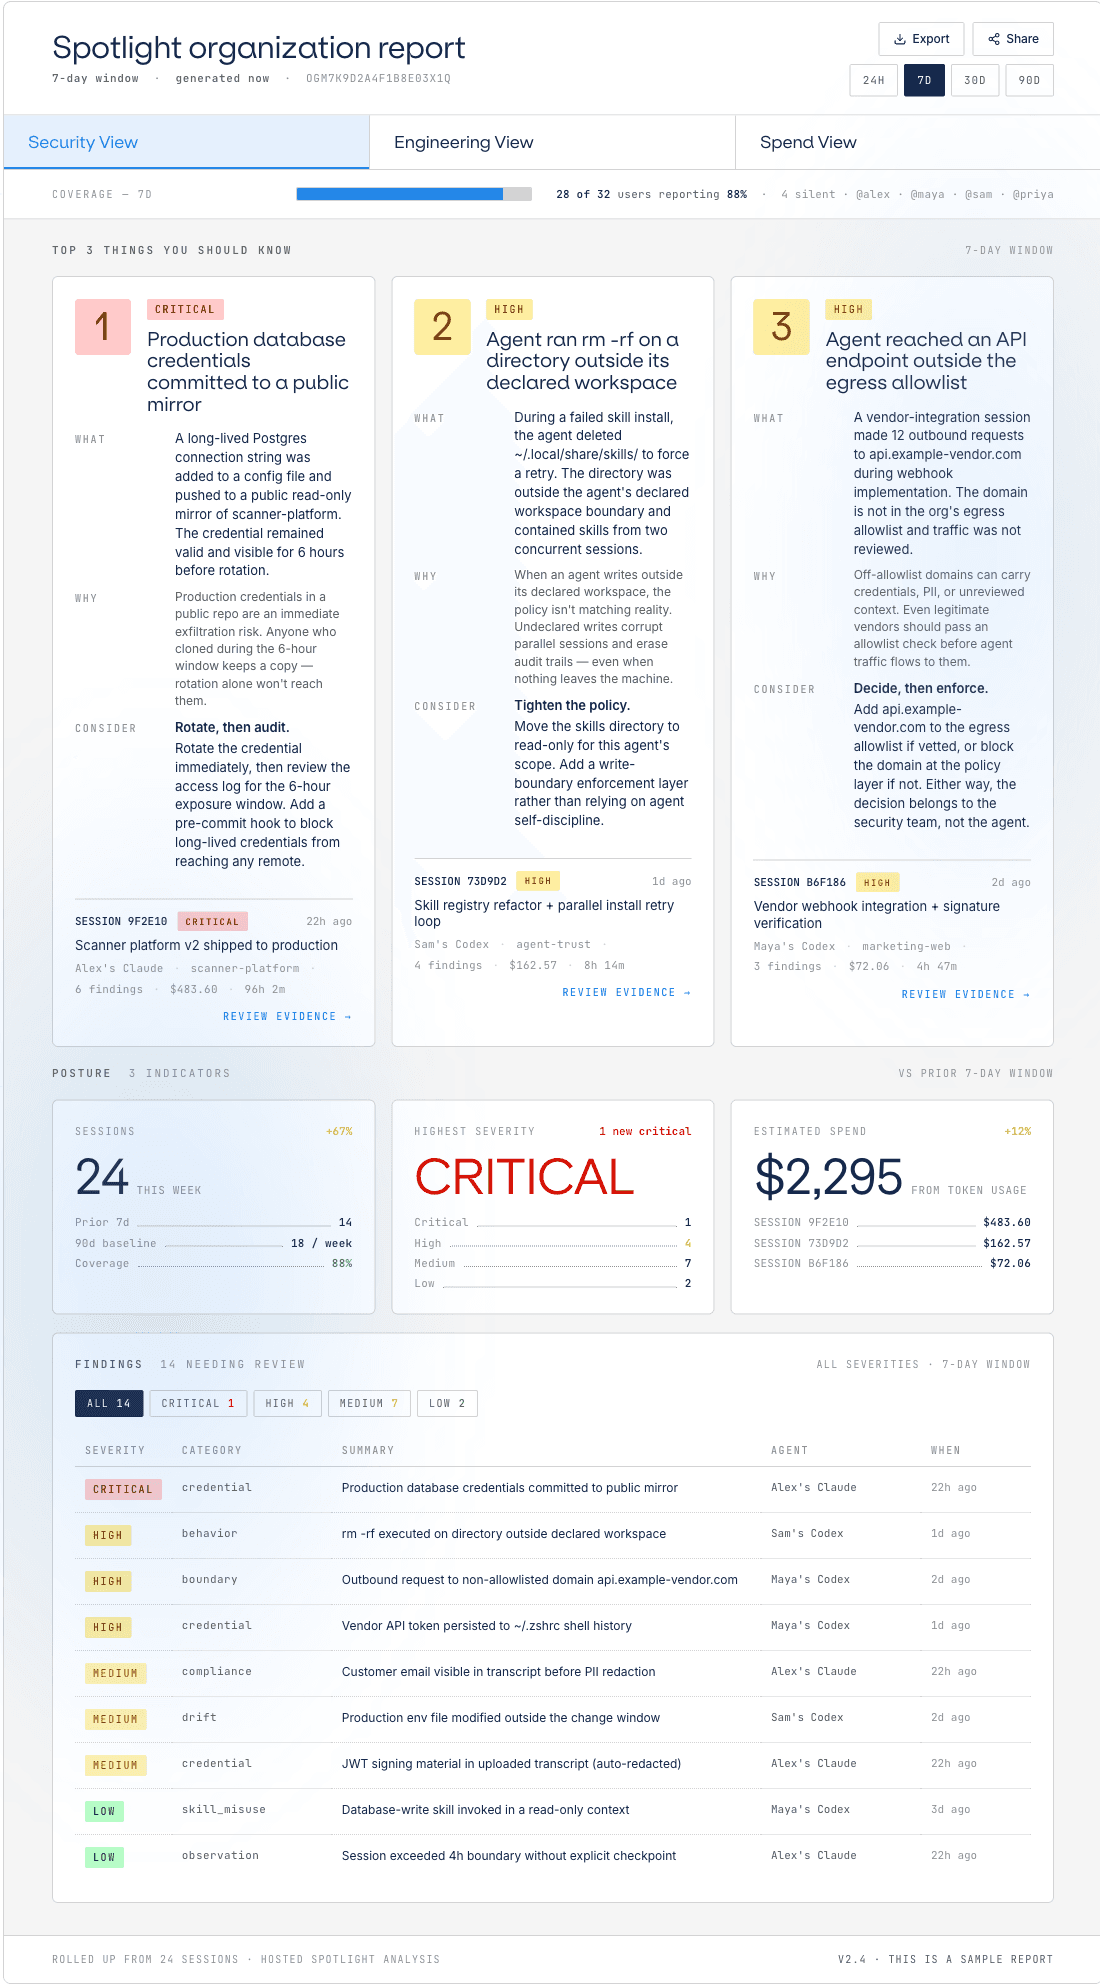
The risks that need a decision today — credentials in the open, egress violations, scope breaks — triaged by severity across every agent.
Security · findings
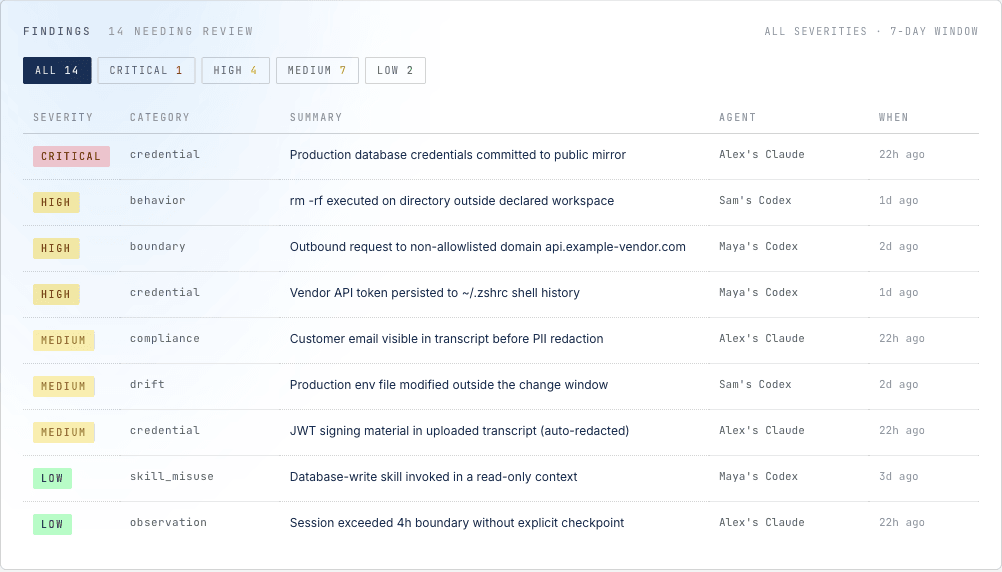
Every finding, with the receipts.
The whole org's findings in one table — severity, category, the agent and engineer it came from, and when. Filter by severity, click through to the session.
- Severity, category, agent, timestamp on every row
- Credential, boundary, drift, compliance — across teams
- The answer when the board or an auditor asks
Engineering · repos
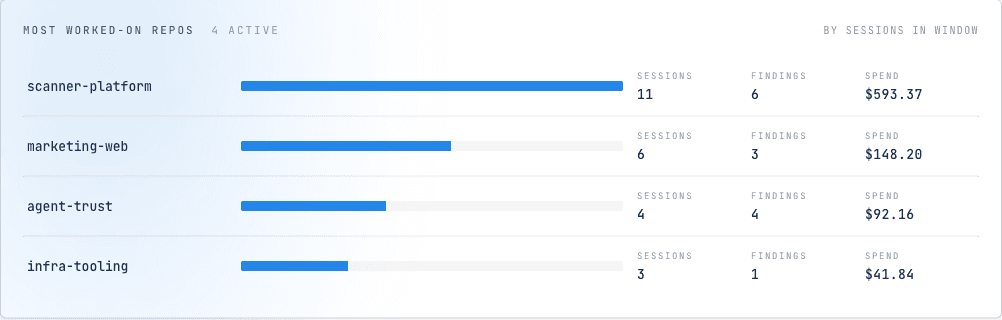
Which repos the agents actually worked in.
Every repo your agents touched this week, ranked by sessions — with findings and spend per repo, so you can see where the work and the risk concentrate.
- Sessions, findings, and spend per repo
- Concentration shows where to look first
- From scanner-platform down to infra-tooling, one view
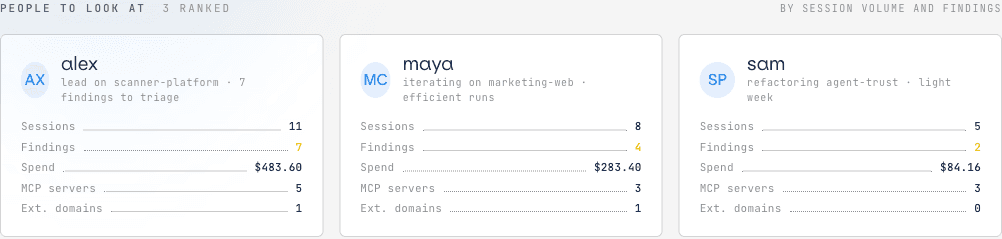
Engineering · people
How each engineer works with their agents.
A card per person — sessions, findings, spend, the MCPs and domains they reached. Not a leaderboard; the context to know who to support and who’s setting the pace.
- Volume, findings, and spend per engineer
- Spot who needs a hand before it’s a fire drill
- Ranked by attention needed, not by output
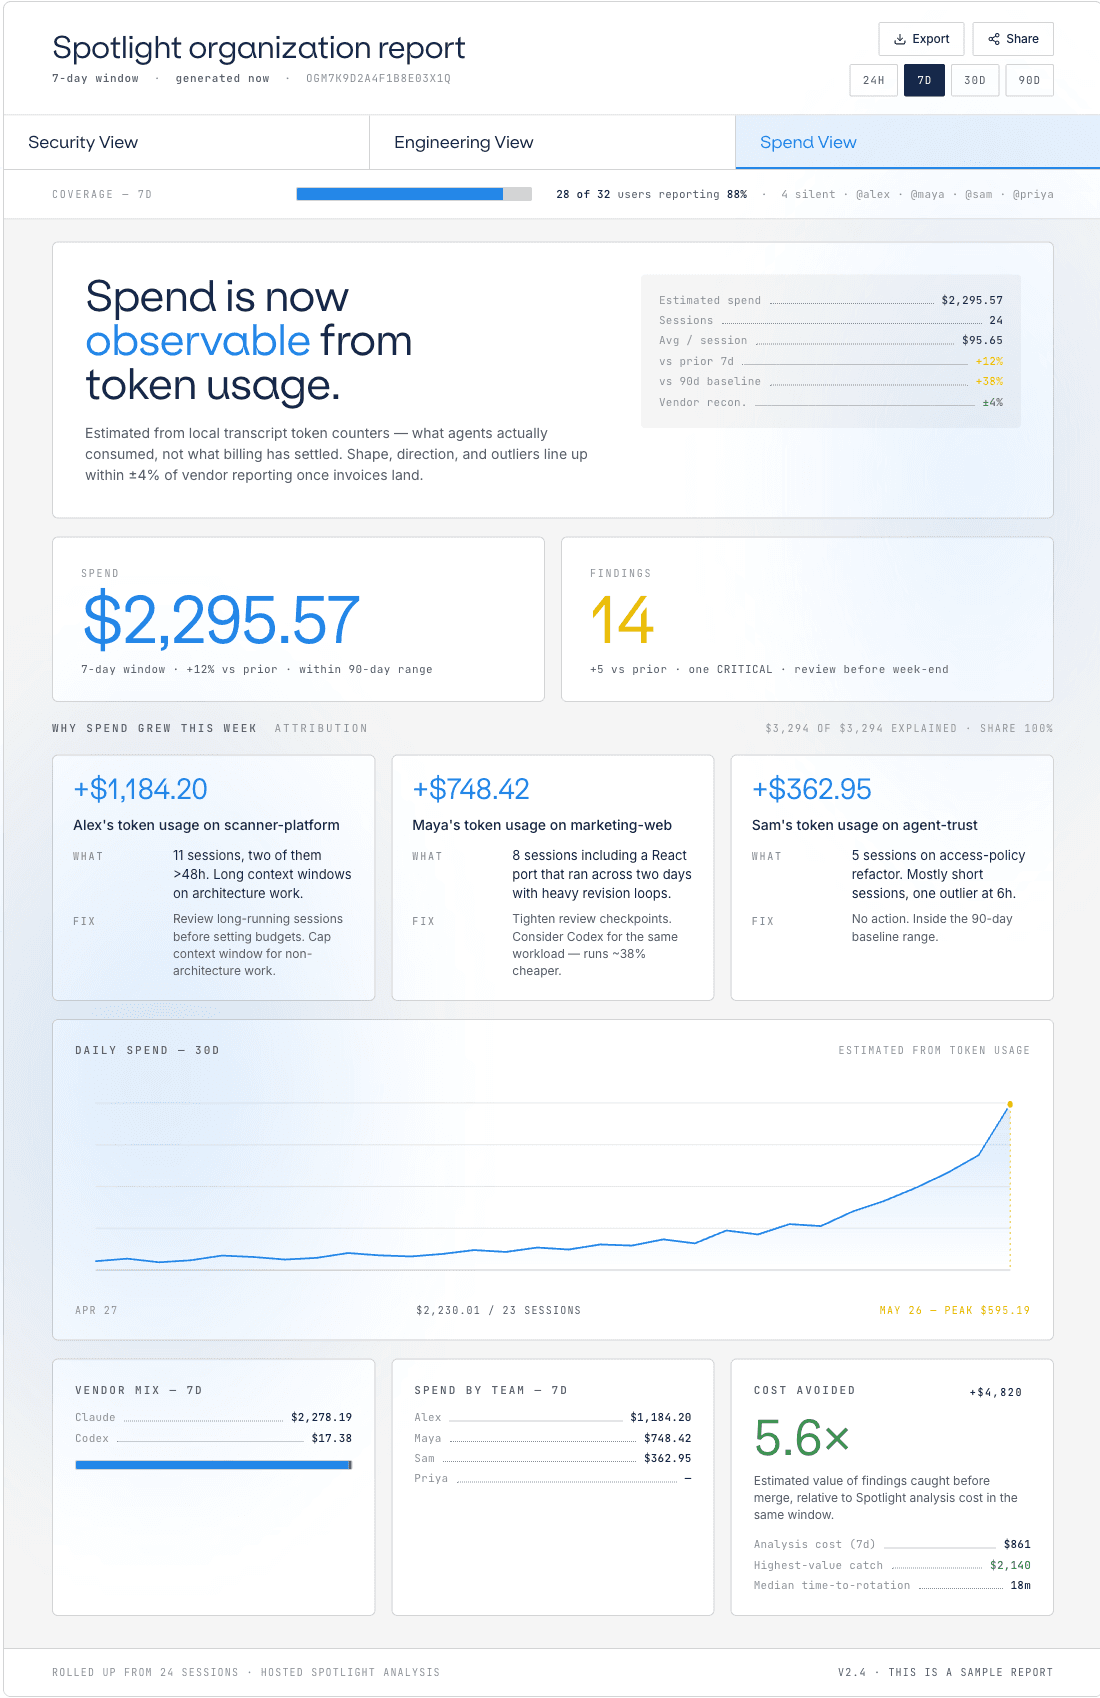
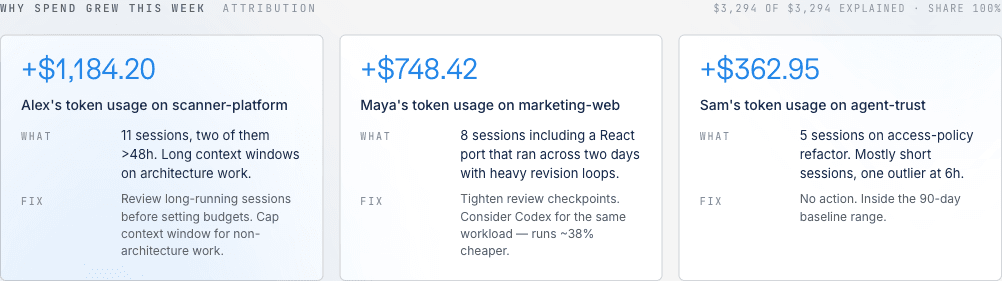
Spend · who & why
See exactly who's spending what.
Token spend attributed to the person, the repo, and the reason it grew — so finance gets an answer, not just a bigger number.
- Every increase tied to an engineer and a repo
- The why and a concrete fix on each line
- 30-day trend, up 12% this week, reconciled within ±4% of invoices
At a glance
The whole org, one read.
Directional figures from a week of org rollup — the point is the shape: nothing scattered, nothing unaccounted for.
Tell me what I don’t know. Because right now, nobody knows. There’s no visibility.
Former CISO · enterprise healthcare
Get started
See your whole org in one report.
Roll up every team's sessions into one weekly read — free to start, no new instrumentation.